Volatile Interest Rates
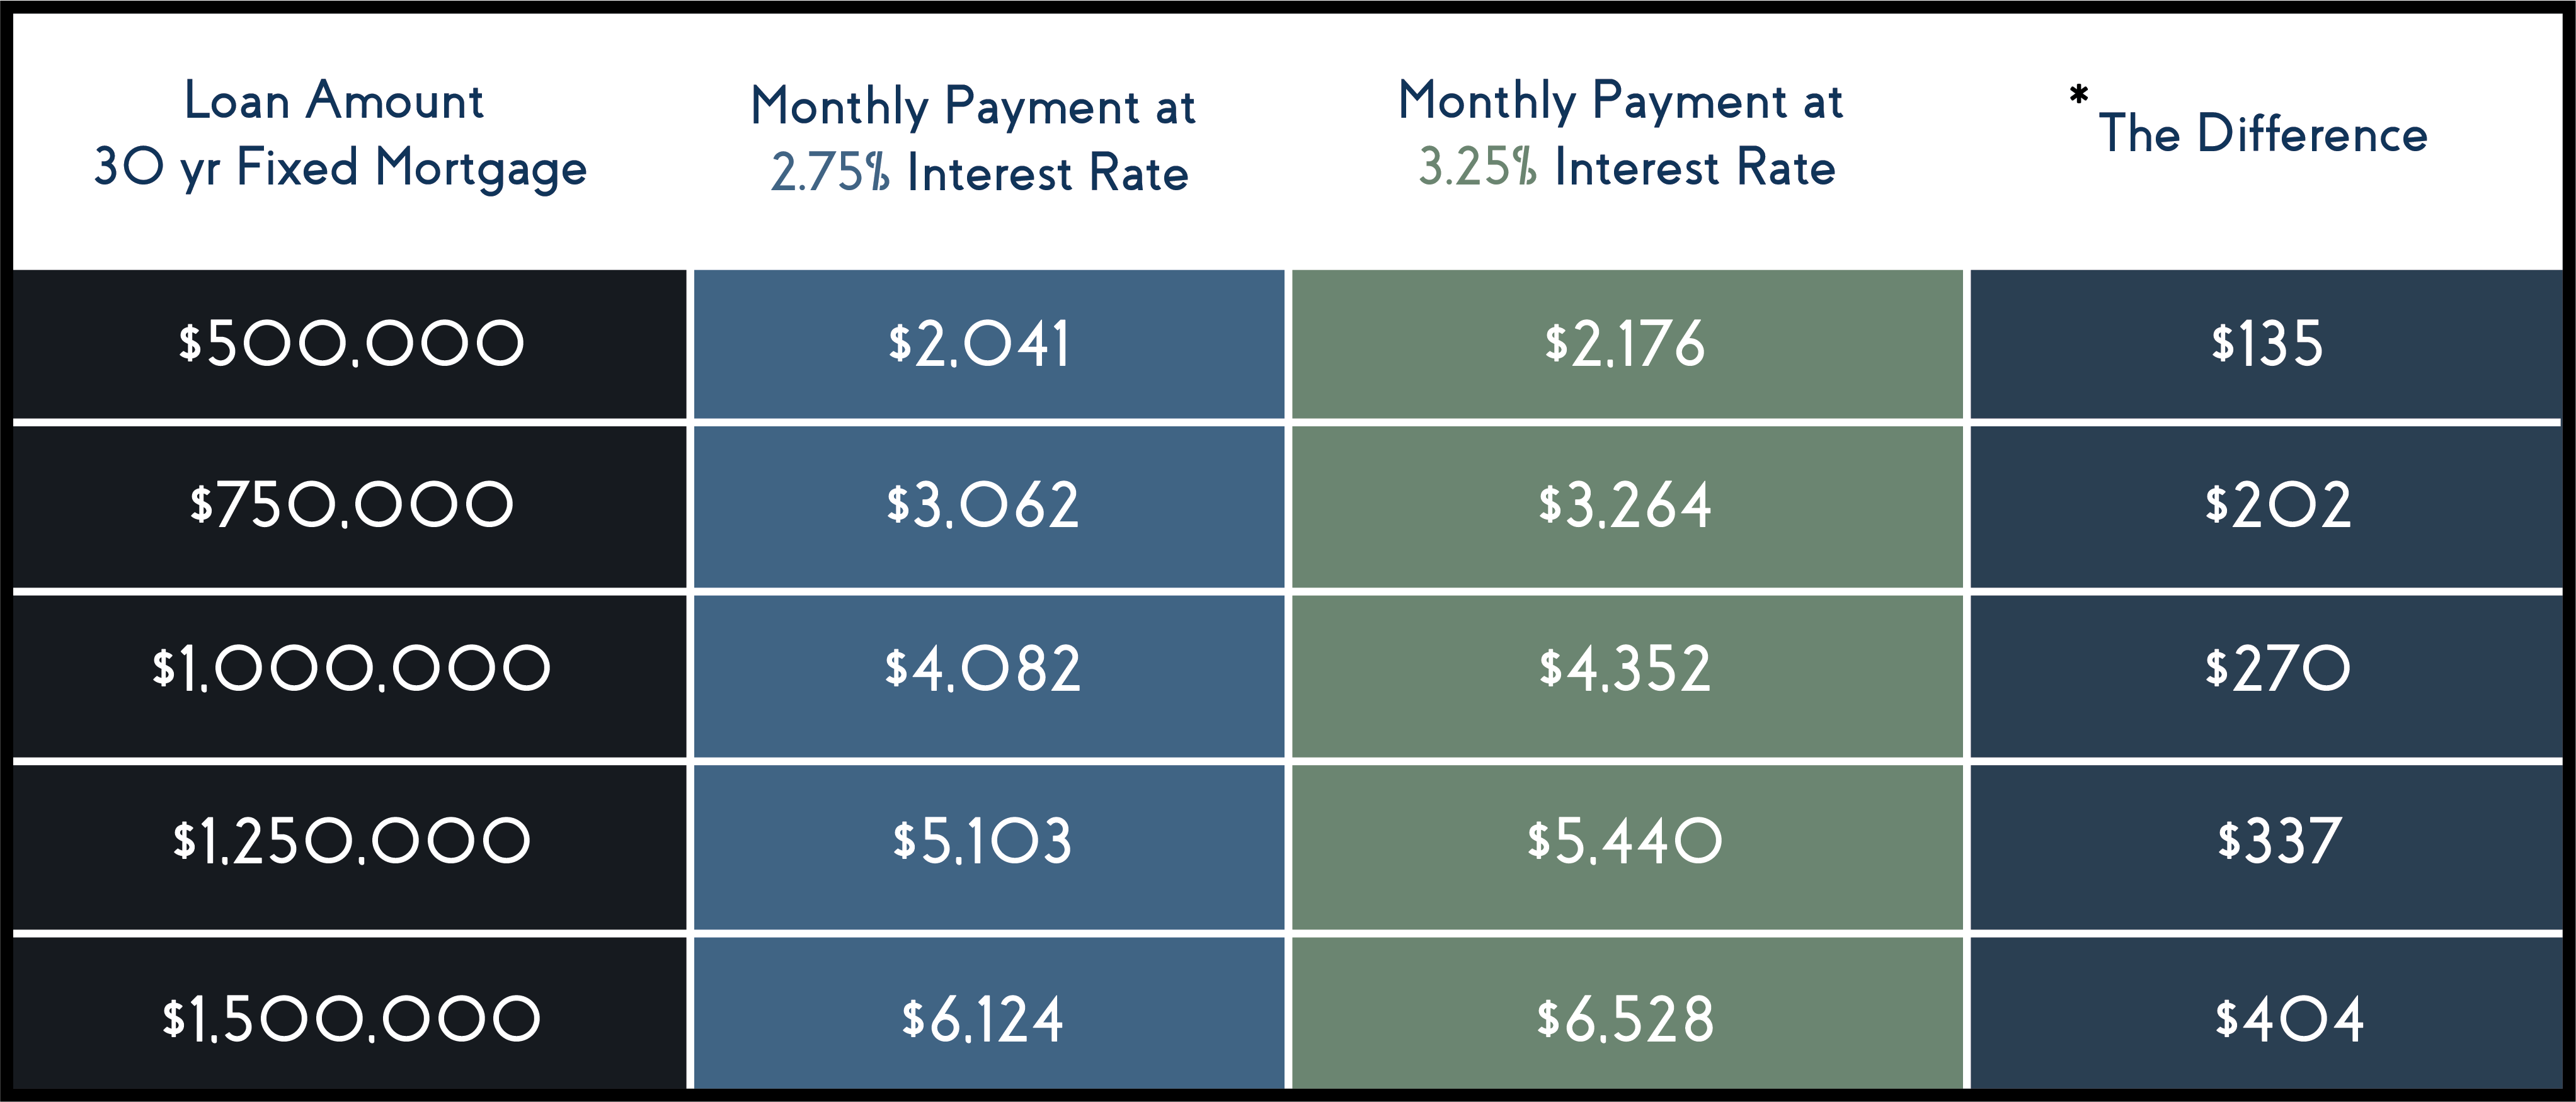
Rates in the last week and a half have shifted drastically and continued to do so this week. Below is the 30yr Bond Chart directly from the market. The lower the blocks go in the chart, the higher the interest rate/pricing will be. The higher the blocks are on the chart, the lower the interest rate/pricing will be. The green blocks reflect positive movement towards the top, for better pricing and the red blocks represent lower movement, for higher interest rate(worse pricing). Now this volatility is expected in a new election year, new stimulus bill conversation, vaccine availability, etc. Can we bounce back from this? The hope is yes, but we cannot give a timeline on how quickly that will be. It is virtually impossible to time the market perfectly. Interest rates in the low 3% are still historically low. The bond market thrives off instability and that is what the pandemic did, 2-3 years from now, we will be wishing we could obtain rates this low.
We have to keep in mind that the rates in the mid-high 2%’s will not be around long-term as the low rates were connected with the pandemic and its effect on our economy and the instability it caused. The pandemic had a negative effect on our economy, our country and our small business owners. Now that we have stimulus bills, vaccines and an outlook on Covid, rates may increase as these things indicate stability in our economy. The goal of purchasing a home should not be solely based on interest rates as there are other important components to consider, such as real estate appreciation, building equity, no longer renting, etc.


The We Fund LA Team


